Defining the front lines
Keep this image burned in your mind as you look at the maps below:

Red states tend to have Republican state governments, Blue ones tend to have Democratic state governments. Watch the "Solid South", especially the Deep South which has never had a liberal state government ever.
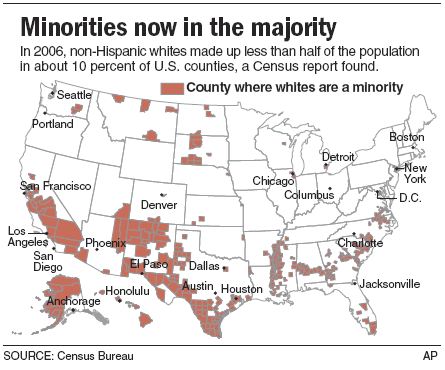
This map shows where the minorities are. They are more or less evenly distributed between red and blue America, so let's ignore democrats using the high minority populations of New York, California, Florida, New Mexico etc. as an excuse for their failures of governance:

Comparing the results of Republican state governments vs Democrat state governments
First of all, our Governors and Congressmen are more skilled, as proven by the amount of federal money they manage to get from Washington (the colours in this map are a mess, Dark blue means lots of pork, white means neutral, and light blue is the inept suckers who pay more taxes than they get back. Yes, because nothing contrasts with blue better than more blue!
 )
)

Our accountants are better, there are more tax-free people in Red states than blue states:

Red State teenagers are more manly and successful. Just look at their success at carrying out every teenage male's #1 priority:

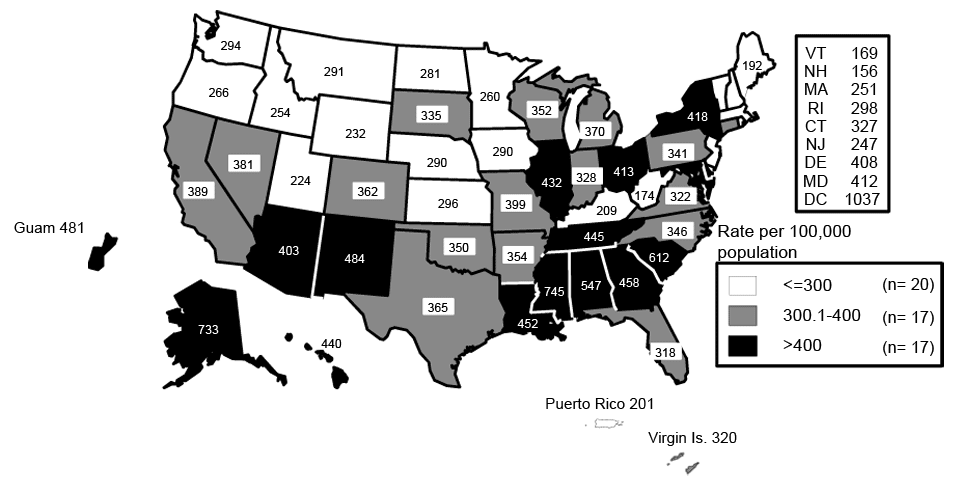
Red state teenagers are less likely to murder their unconceived children with condoms, as this map of STD rates proves:

We value marriage so much we can't settle for just one:

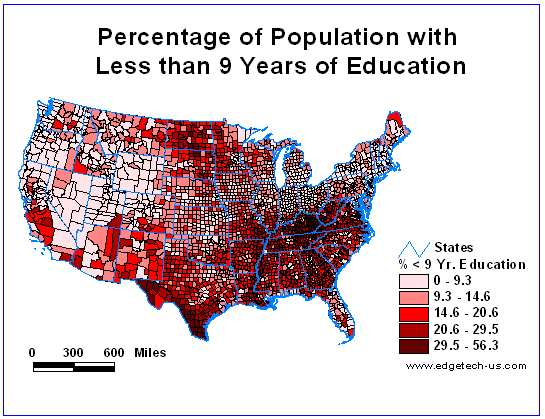
No egghead academic know-it-alls here:

Here are cities organized by "income mobility", meaning there's lots of rags-to-riches stories that make a mockery of inheritance, the finest incentive for hard work there is. The Bible says that the sons will inherit the sins of the fathers, but some try to thwart God's will. The ones with the most jumped-up uppity new money are on top, with stable, traditional patterns of wealth at the bottom. Red are ones in Red States, Blue ones are in Blue States:
Salt Lake City Utah
Scranton Pennsylvania
Reading Pennsylvania
Des Moines Iowa
Bakersfield California
Toms River New Jersey
Pittsburgh Pennsylvania
Allentown Pennsylvania
Honolulu Hawaii
San Jose California
Santa Barbara California
Boston Massachusetts
Madison Wisconsin
San Francisco California
San Diego California
Manchester New Hampshire
Minneapolis Minnesota
Brownsville Texas
Newark New Jersey
Harrisburg Pennsylvania
New York New York
El Paso Texas
Erie Pennsylvania
Los Angeles California
Providence Rhode Island
Washington DC District of Columbia
Seattle Washington
Albany New York
Omaha Nebraska
Spokane Washington
Portland Maine
Houston Texas
Sacramento California
Poughkeepsie New York
Bridgeport Connecticut
Modesto California
Syracuse New York
Fort Worth Texas
Santa Rosa California
Denver Colorado
Oklahoma City Oklahoma
Buffalo New York
Canton Ohio
Tulsa Oklahoma
Springfield Massachusetts
Rockford Illinois
Miami Florida
Youngstown Ohio
Fresno California
Portland Oregon
San Antonio Texas
Philadelphia Pennsylvania
Gary Indiana
Eugene Oregon
Austin Texas
Dallas Texas
Phoenix Arizona
Grand Rapids Michigan
Kansas City Missouri
Las Vegas Nevada
Tucson Arizona
Pensacola Florida
Cape Coral Florida
Lakeland Florida
Chicago Illinois
Toledo Ohio
Milwaukee Wisconsin
Baton Rouge Louisiana
Albuquerque New Mexico
Sarasota Florida 39.2
South Bend Indiana 39.2
Tampa Florida 39.1
Orlando Florida 39.1
Port St. Lucie Florida
Baltimore Maryland
St. Louis Missouri
Dayton Ohio
Cleveland Ohio
Nashville Tennessee
New Orleans Louisiana
Mobile Alabama
Little Rock Arkansas
Virginia Beach Virginia
Louisville Kentucky
Richmond Virginia
Cincinnati Ohio 37.9 0.429 5.1%
Knoxville Tennessee
Columbus Ohio
Birmingham Alabama
Jacksonville Florida
Detroit Michigan
Indianapolis Indiana
Greenville South Carolina
Raleigh North Carolina
Greensboro North Carolina
Atlanta Georgia
Columbia South Carolina
Charlotte North Carolina
Fayetteville North Carolina
Memphis Tennessee
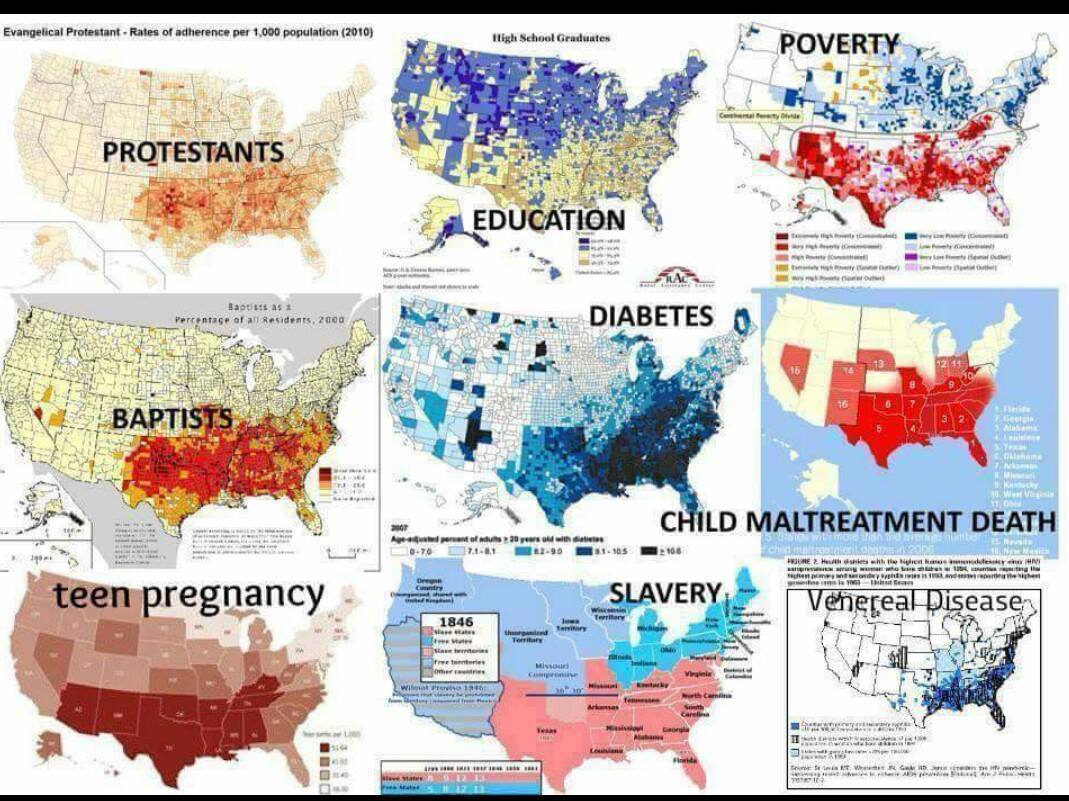
Wonder what the cause of the vast difference between Republican and Democrat states is? Here's a clue (note that they reversed the colors):

Keep this image burned in your mind as you look at the maps below:
Red states tend to have Republican state governments, Blue ones tend to have Democratic state governments. Watch the "Solid South", especially the Deep South which has never had a liberal state government ever.
This map shows where the minorities are. They are more or less evenly distributed between red and blue America, so let's ignore democrats using the high minority populations of New York, California, Florida, New Mexico etc. as an excuse for their failures of governance:

Comparing the results of Republican state governments vs Democrat state governments
First of all, our Governors and Congressmen are more skilled, as proven by the amount of federal money they manage to get from Washington (the colours in this map are a mess, Dark blue means lots of pork, white means neutral, and light blue is the inept suckers who pay more taxes than they get back. Yes, because nothing contrasts with blue better than more blue!

 )
)
Our accountants are better, there are more tax-free people in Red states than blue states:

Red State teenagers are more manly and successful. Just look at their success at carrying out every teenage male's #1 priority:

Red state teenagers are less likely to murder their unconceived children with condoms, as this map of STD rates proves:

We value marriage so much we can't settle for just one:

No egghead academic know-it-alls here:

Here are cities organized by "income mobility", meaning there's lots of rags-to-riches stories that make a mockery of inheritance, the finest incentive for hard work there is. The Bible says that the sons will inherit the sins of the fathers, but some try to thwart God's will. The ones with the most jumped-up uppity new money are on top, with stable, traditional patterns of wealth at the bottom. Red are ones in Red States, Blue ones are in Blue States:
Salt Lake City Utah
Scranton Pennsylvania
Reading Pennsylvania
Des Moines Iowa
Bakersfield California
Toms River New Jersey
Pittsburgh Pennsylvania
Allentown Pennsylvania
Honolulu Hawaii
San Jose California
Santa Barbara California
Boston Massachusetts
Madison Wisconsin
San Francisco California
San Diego California
Manchester New Hampshire
Minneapolis Minnesota
Brownsville Texas
Newark New Jersey
Harrisburg Pennsylvania
New York New York
El Paso Texas
Erie Pennsylvania
Los Angeles California
Providence Rhode Island
Washington DC District of Columbia
Seattle Washington
Albany New York
Omaha Nebraska
Spokane Washington
Portland Maine
Houston Texas
Sacramento California
Poughkeepsie New York
Bridgeport Connecticut
Modesto California
Syracuse New York
Fort Worth Texas
Santa Rosa California
Denver Colorado
Oklahoma City Oklahoma
Buffalo New York
Canton Ohio
Tulsa Oklahoma
Springfield Massachusetts
Rockford Illinois
Miami Florida
Youngstown Ohio
Fresno California
Portland Oregon
San Antonio Texas
Philadelphia Pennsylvania
Gary Indiana
Eugene Oregon
Austin Texas
Dallas Texas
Phoenix Arizona
Grand Rapids Michigan
Kansas City Missouri
Las Vegas Nevada
Tucson Arizona
Pensacola Florida
Cape Coral Florida
Lakeland Florida
Chicago Illinois
Toledo Ohio
Milwaukee Wisconsin
Baton Rouge Louisiana
Albuquerque New Mexico
Sarasota Florida 39.2
South Bend Indiana 39.2
Tampa Florida 39.1
Orlando Florida 39.1
Port St. Lucie Florida
Baltimore Maryland
St. Louis Missouri
Dayton Ohio
Cleveland Ohio
Nashville Tennessee
New Orleans Louisiana
Mobile Alabama
Little Rock Arkansas
Virginia Beach Virginia
Louisville Kentucky
Richmond Virginia
Cincinnati Ohio 37.9 0.429 5.1%
Knoxville Tennessee
Columbus Ohio
Birmingham Alabama
Jacksonville Florida
Detroit Michigan
Indianapolis Indiana
Greenville South Carolina
Raleigh North Carolina
Greensboro North Carolina
Atlanta Georgia
Columbia South Carolina
Charlotte North Carolina
Fayetteville North Carolina
Memphis Tennessee
Wonder what the cause of the vast difference between Republican and Democrat states is? Here's a clue (note that they reversed the colors):


Comment